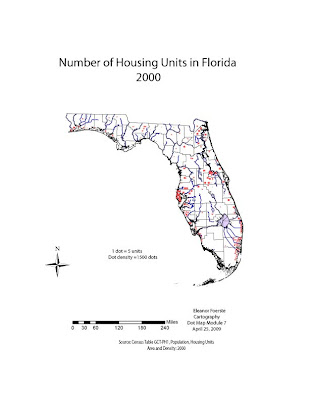
I am so excited! I learned how to make dots into symbols and use them to copy from the symbol library into my document. Saved a lot of time, but does not look as evenly distributed as some of the other maps. Having dots in symbol blocks of 20, 18, 8, 10, 5, 3 and 2 made it go much easier for me. I had put off doing this map because I knew there was an easier way than I was doing with one dot at a time. There is a way to copy with the spray tool and one of the other tools but I could not keep a good count. With the symbol tool, I was able to spread them out a little, yet keep a count. I can see the aesthetic value of individual placement but found the symbol tool helped me to get caught up with my work and class load.
I re-read one of my previous posts and remembered pdf files are too large so I had to export as jpg insted of save as pdf!!! The map is also posted on the S drive.
I calculated the Housing density (housing units/total area) in the excel sheet by adding a column and using the formula. The highest density is Pinellas County with 793 units standardized by area. That compares to a low in Lavayette, Liberty and Glades County with 4 to 6 units/acre density.
In order to get 173 dots into the Pinellas County space, I sized them at .7 x .7 pixels. I kept the water and wetland layer on to assist in dot placent, near coastal areas and urban centers. After placing dots, I turned off the lables and wetland layers. I left the water layer to see where the housing density is in relation to the water.

No comments:
Post a Comment